Monitor Digital Business Performance with New Executive Reporting
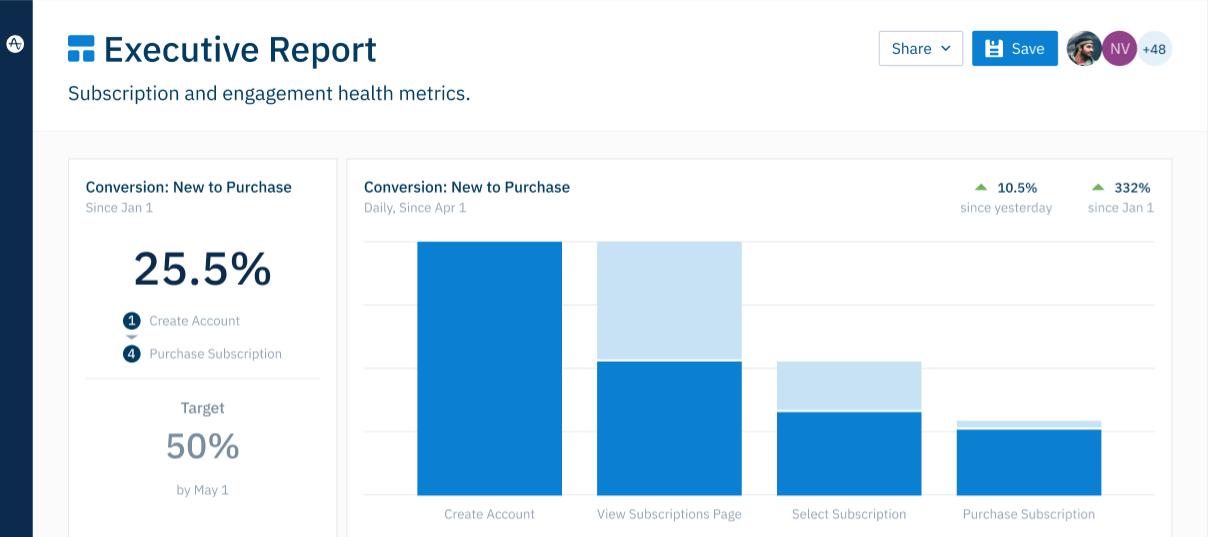
We’re pleased to announce Executive Reporting, a series of powerful upgrades to our Dashboards that help leaders monitor digital business performance. Customers can now set and track progress to a target metric, add critical context as notes throughout the Dashboard, and more flexibly customize the layout of any report...
Proactive Data Governance to Increase Data Quality Faster
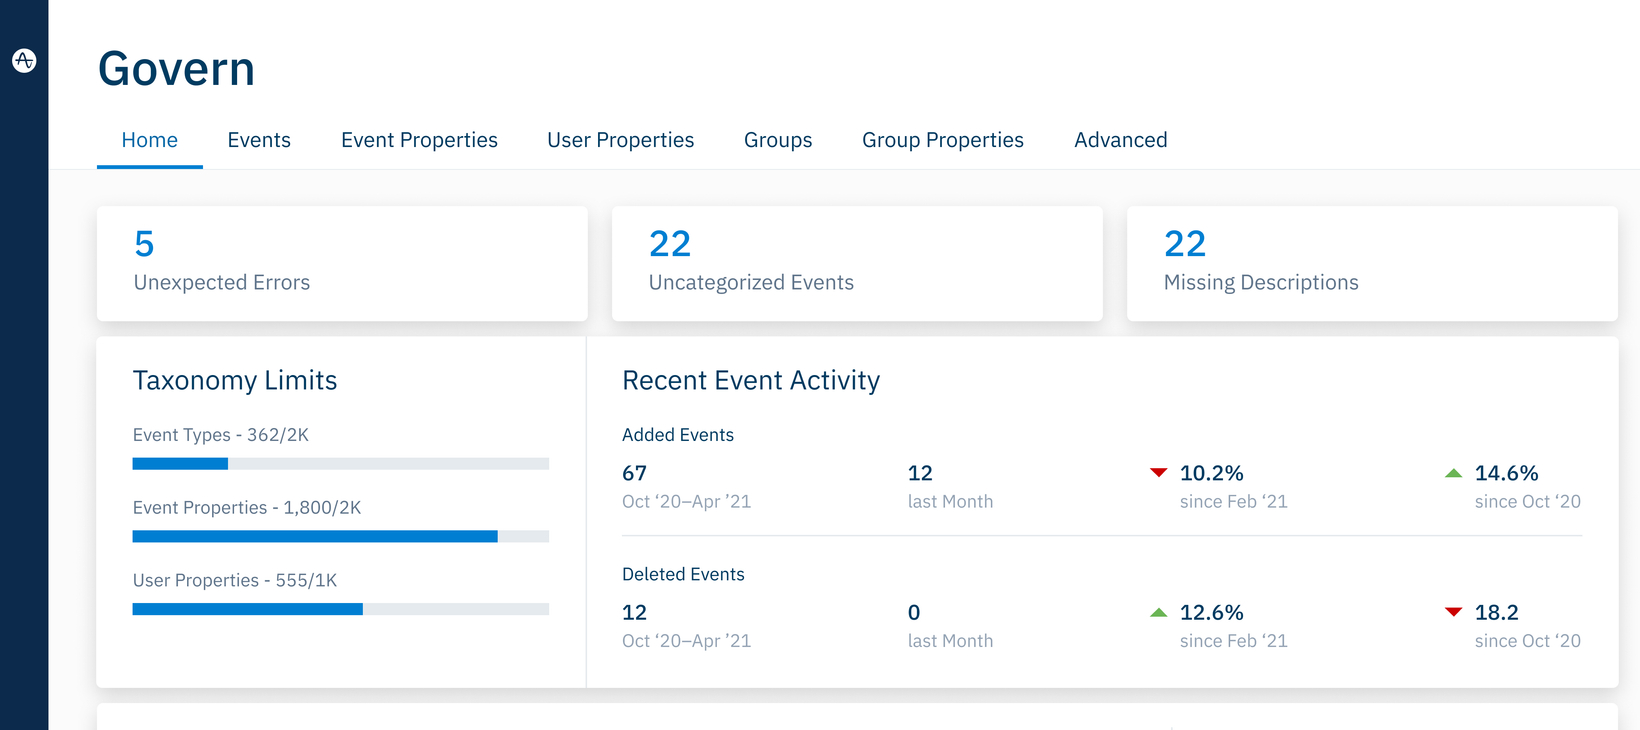
We are thrilled to announce several new data management capabilities to proactively surface issues in your data. These updates enhance our existing data management experience—Govern—with the addition of new tools to help your team audit data, spot unusual events, and keep taxonomy consistent across your team’s usage of Amplitude...
Introducing Amplitude Recommend - The First Self-Serve Personalization Engine
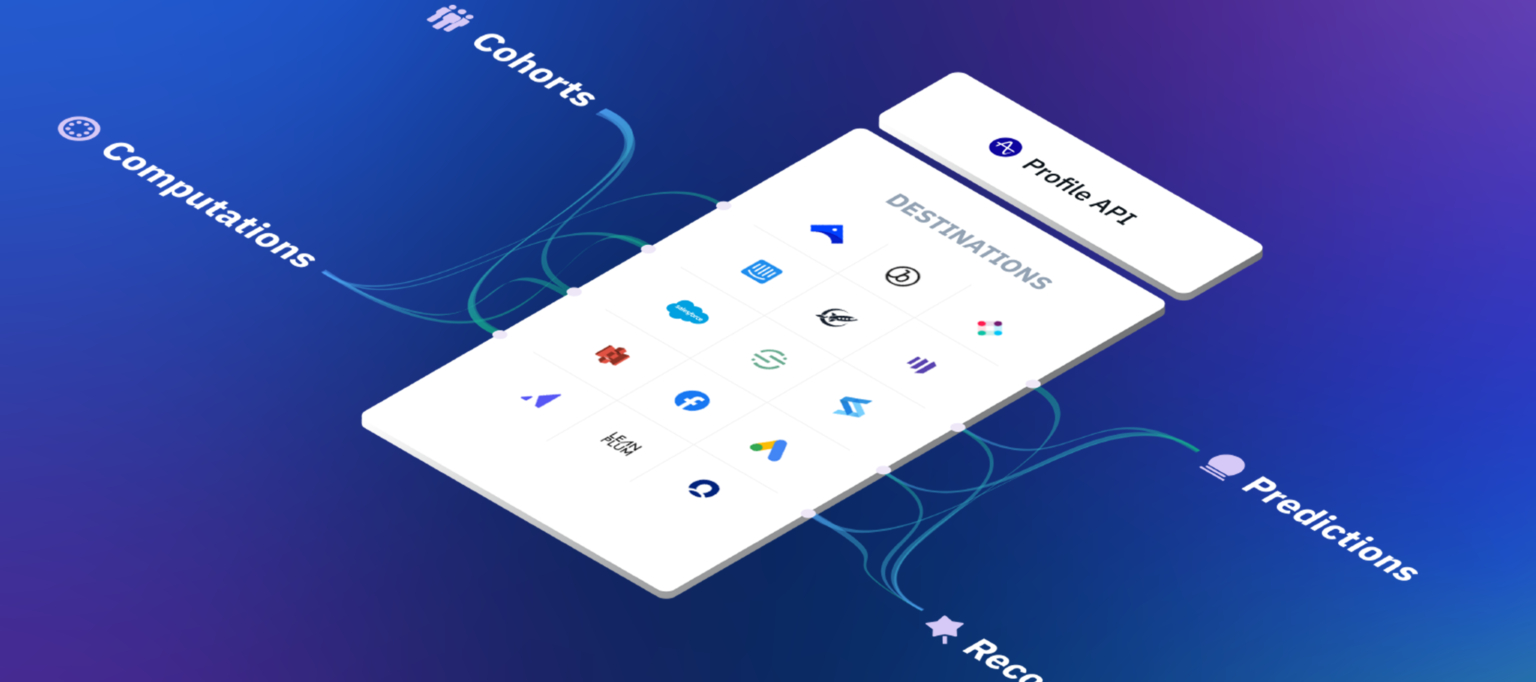
Today we’re launching Amplitude Recommend, a new personalization product that gives all digital companies the power to produce personalized experiences at scale; accelerating your roadmap by years, increasing conversion lift—often by double digits—and reducing the cost by millions.
Measure Time Spent and Event-Based Engagement in User Sessions
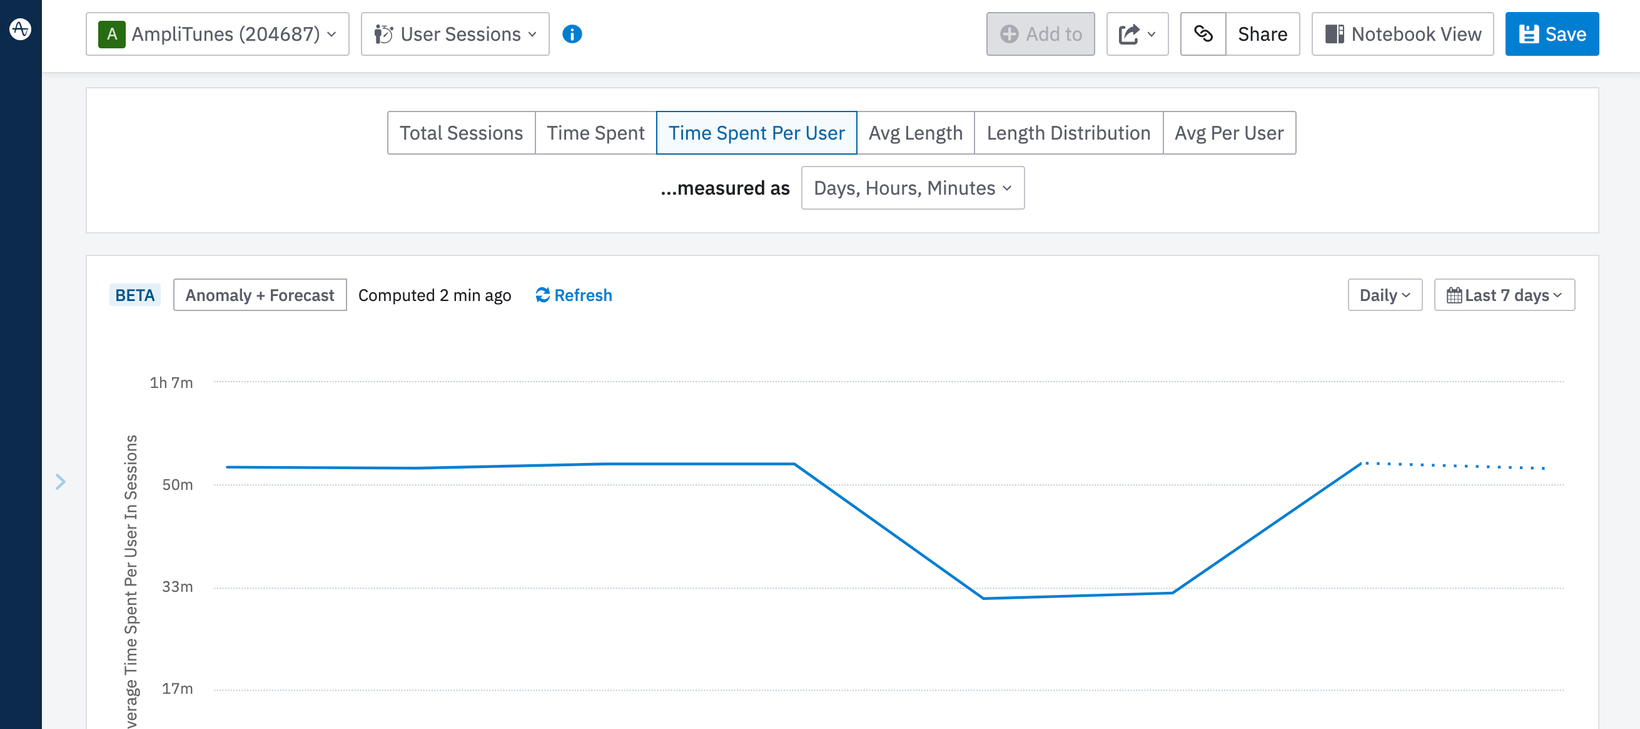
The User Sessions chart helps you understand customer engagement through a session-based lens. In Q1, Amplitude brought new capabilities to User Sessions that enable you to easily measure time spent in your product, and to measure engagement with specific features within sessions...
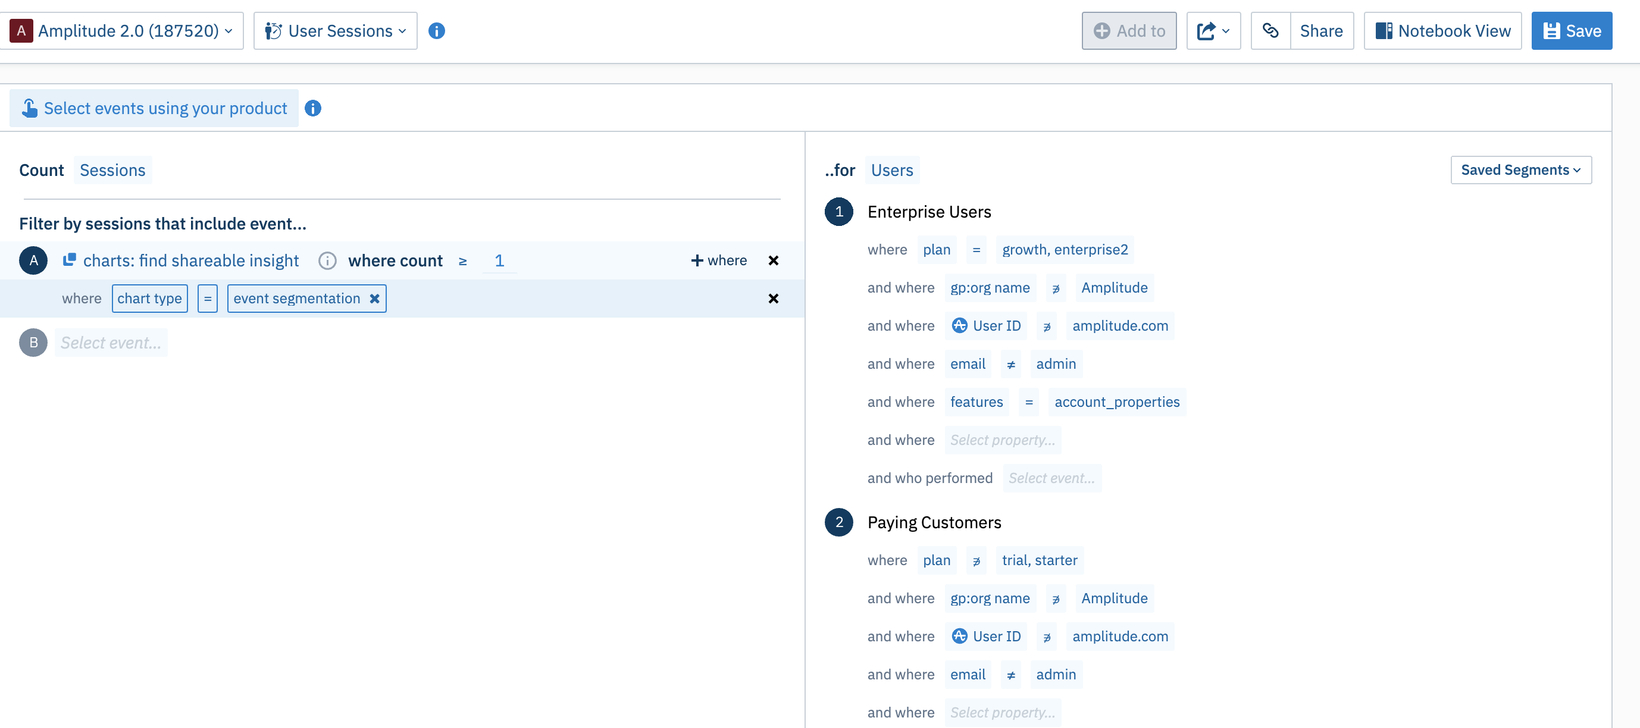
Event Filters in User Sessions Charts
We’ve added support for event filtering in user sessions charts. You can now select multiple events they want included in sessions analysis, filter by how many times that event was seen and filter on specific properties for those events. This allows you to limit analyses like time spent to customers who perform specific behaviors, like play song or video.
 Ever wanted to add contextual notes to an individual chart on a dashboard? This is now possible with Dashboard Chart Notes...
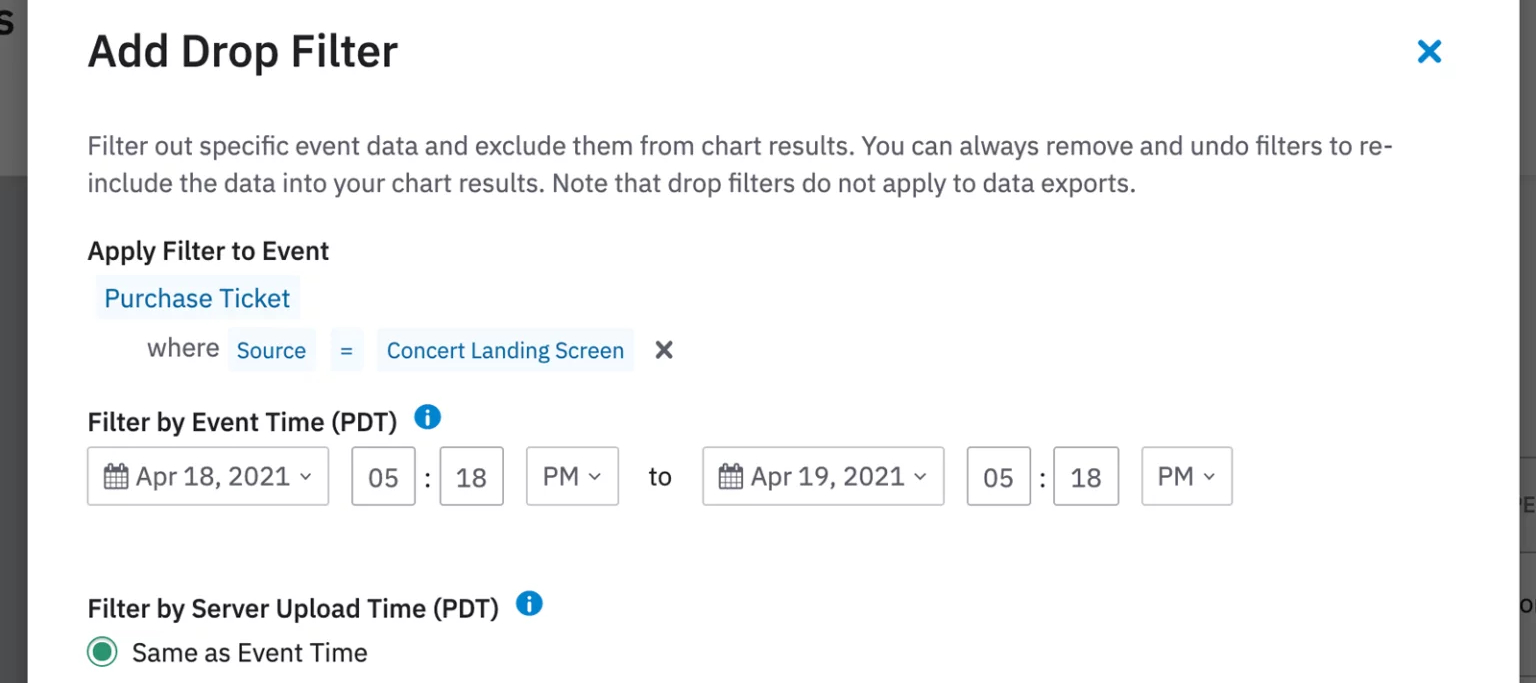 Introducing drop Filters—a new data filter in Govern—allows you to remove specific event data from your charts at query time. These events are not deleted, and can be restored to your charts simply by editing or deleting the Drop Filter.

Custom Event Names on X-Axis for Bar Charts
You now have the ability to add your own X-Axis chart labels to bar charts! Simply double-click on the event name to customize the text, or delete your...

Amplitude-iOS support for WatchOS
Amplitude-iOS has added support for Apple's watchOS platform, enabling customers to instrument their Apple Watch apps. With this feature, our iOS SDK is fully cross-platform and our customers can now integrate Amplitude with all Apple products...
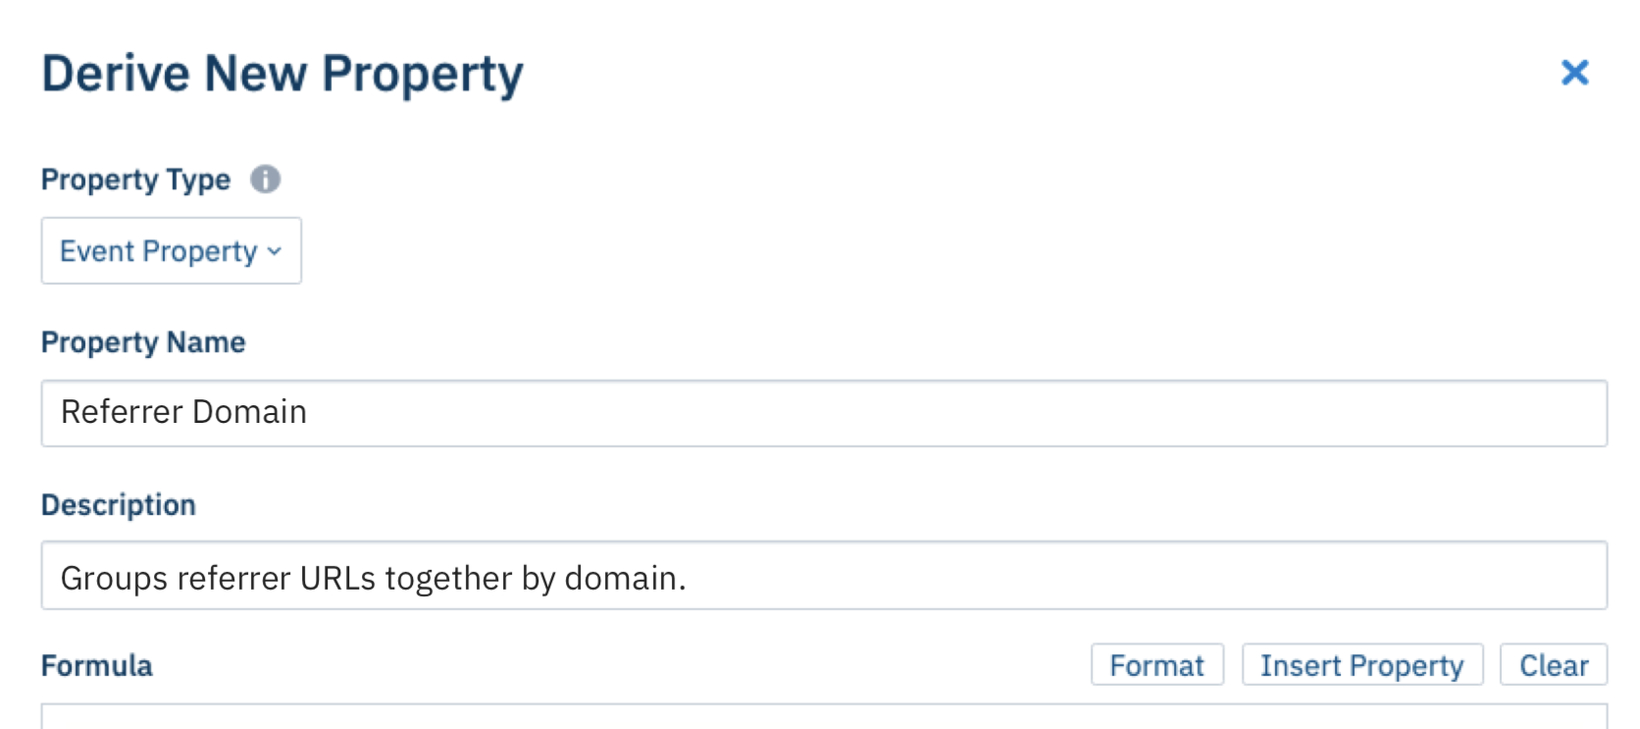 Sometimes a valuable customer metric is not captured explicitly in event data, but can be derived or inferred from existing properties. With Derived Properties in Govern, you can create new events and user properties on the fly, without having to update your instrumentation...


