- DATE:
- AUTHOR:
- Grant Wensley
Measure Time Spent and Event-Based Engagement in User Sessions
The User Sessions chart helps you understand customer engagement through a session-based lens. In Q1, Amplitude brought new capabilities to User Sessions that enable you to easily measure time spent in your product and to measure engagement with specific features within sessions.
Media, gaming, or streaming companies measure their success based on the time customers spend engaging with their products, and their total customer engagements. By working with customers like NBC, we’ve identified which time spent metrics provide the most valuable insights to engagement-focused product teams, and addressed them with four new features:
Total time spent: Graphs the total sum of all session lengths within the interval.
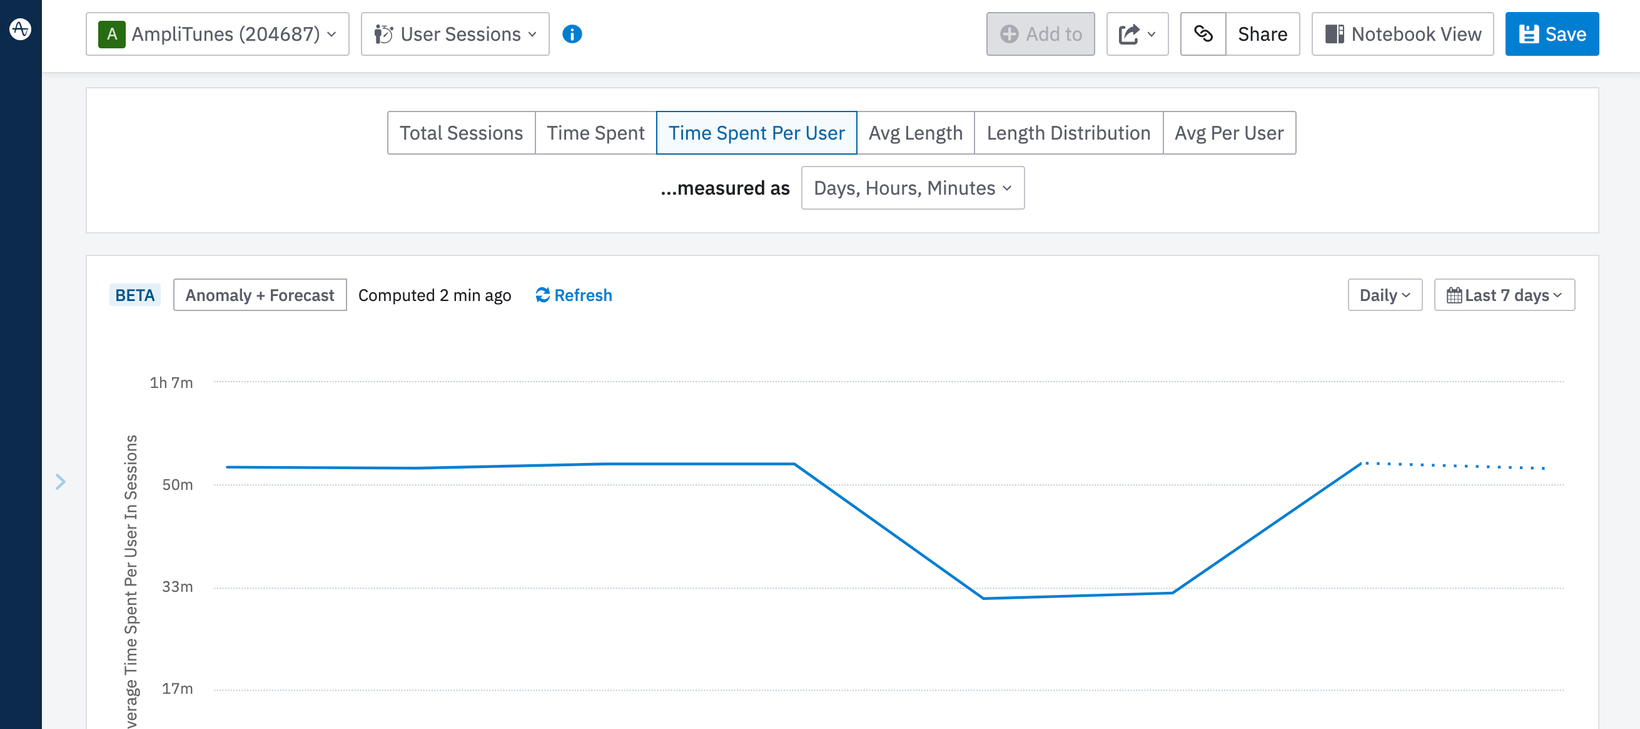
Average time spent per user: Graphs the average amount of time spent in sessions per interval (total time spent / total active users).
Total session counts: Graphs the total number of sessions across all users.
Customizable session duration bins: Allow you to customize duration bins in session length distribution to better fit your product, or to create cohorts of users with a specified session length for further analysis or targeting.

In addition, you can now measure feature engagement per session through the Events performed within sessions toggle, and three new charts views:
Average events per session: Graphs the average event counts across all sessions from all users within the chart interval.
Total events across sessions: Graphs the total number of events across all users within the interval.
Total session counts: Graphs the total number of sessions across all users.