Loading...
April 2021

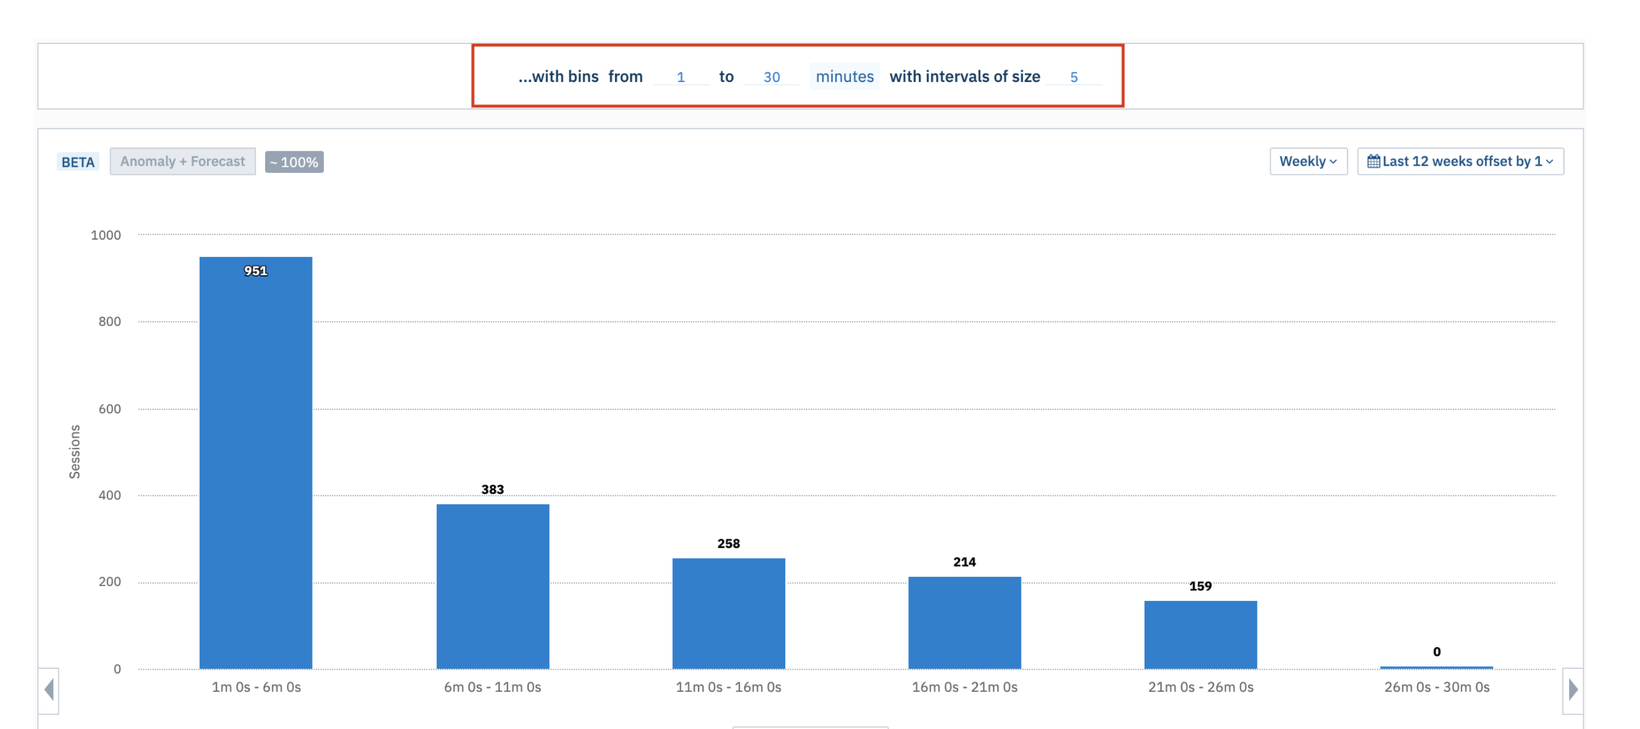
Histogram Bin Customizations in User Sessions Charts
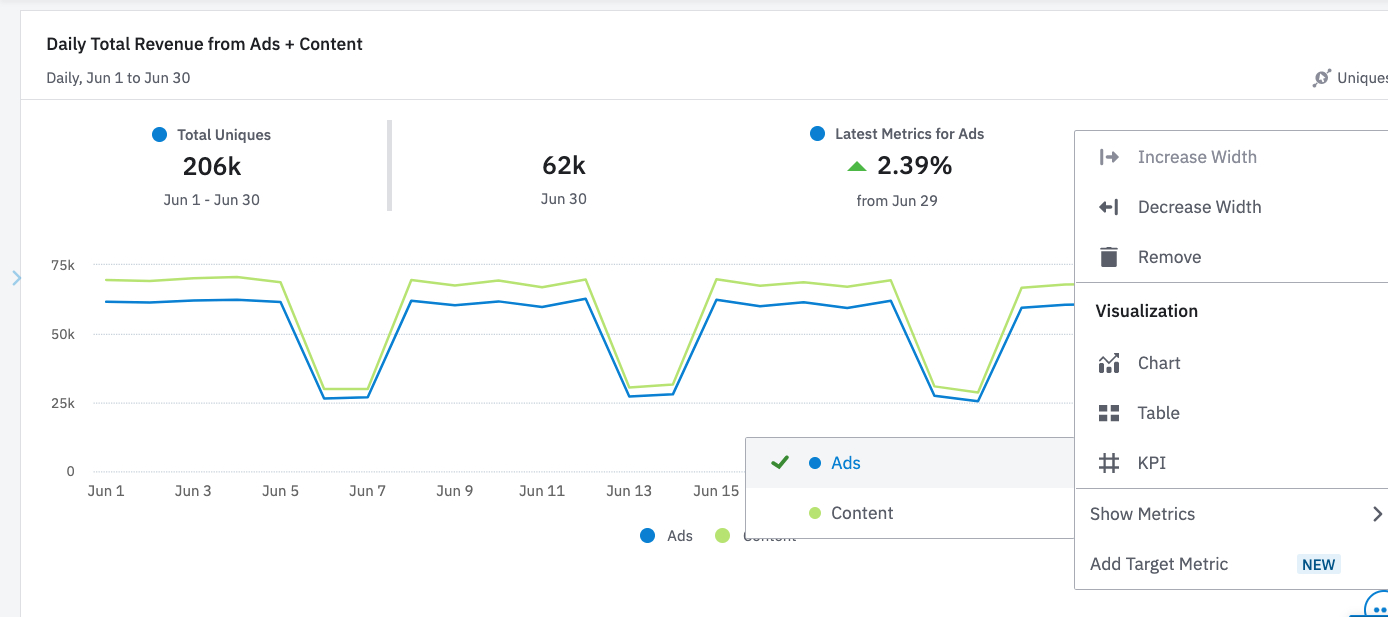
Series selection for metrics in dashboards
React Native SDK v2
February 2021

Product Analytics
Growth
Scholarship
Enterprise
Cohort Populations Over Time

Data Management
Enterprise
Govern add-on
Govern
Collaboration
Enterprise
Permission Groups
Growth
Scholarship
Enterprise
Event Explorer

Behavioral Targeting
Google Ads & Salesforce Marketing Cloud Integrations
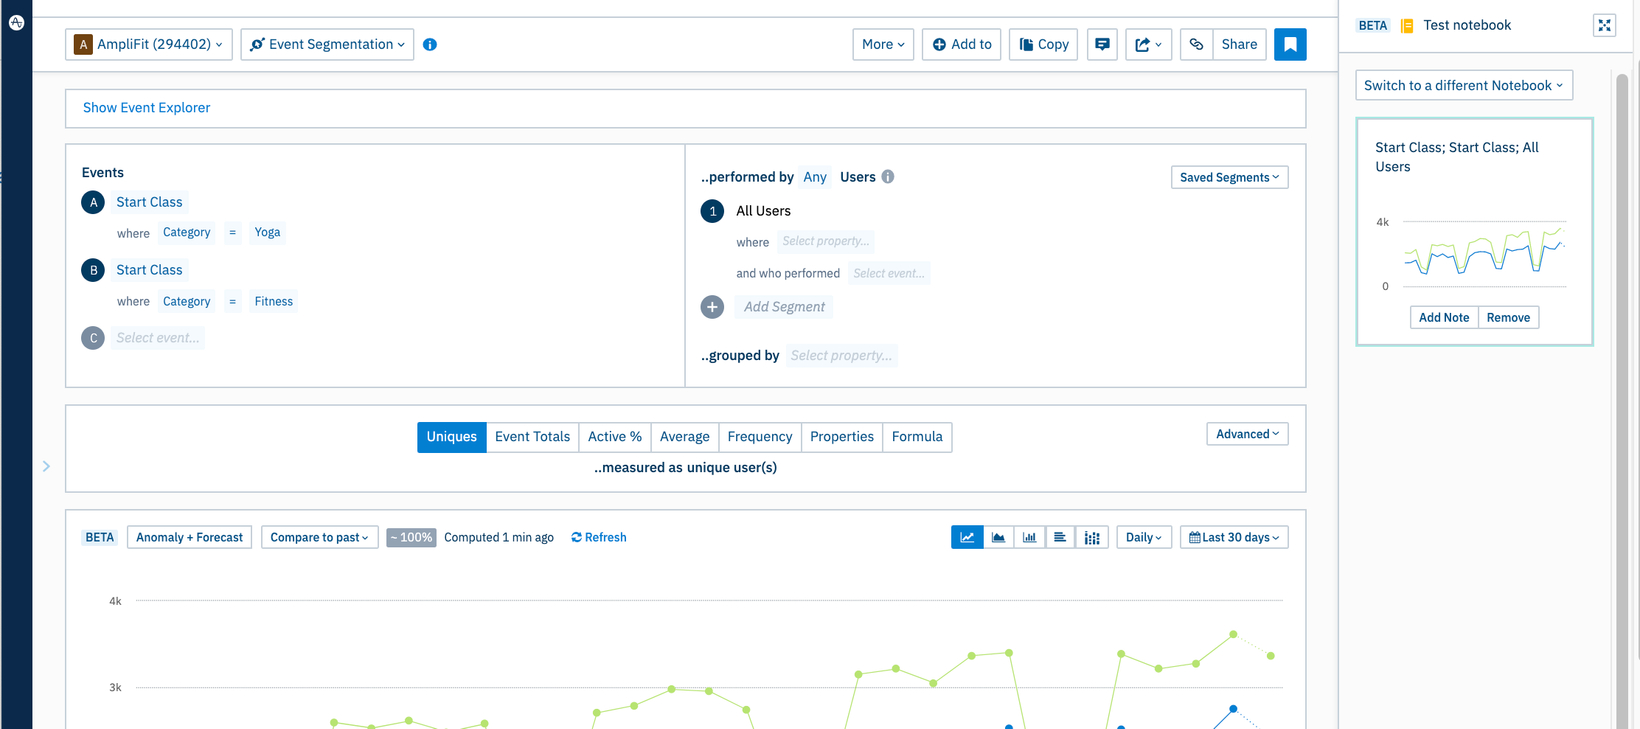
Collaboration
Growth
Scholarship
Enterprise
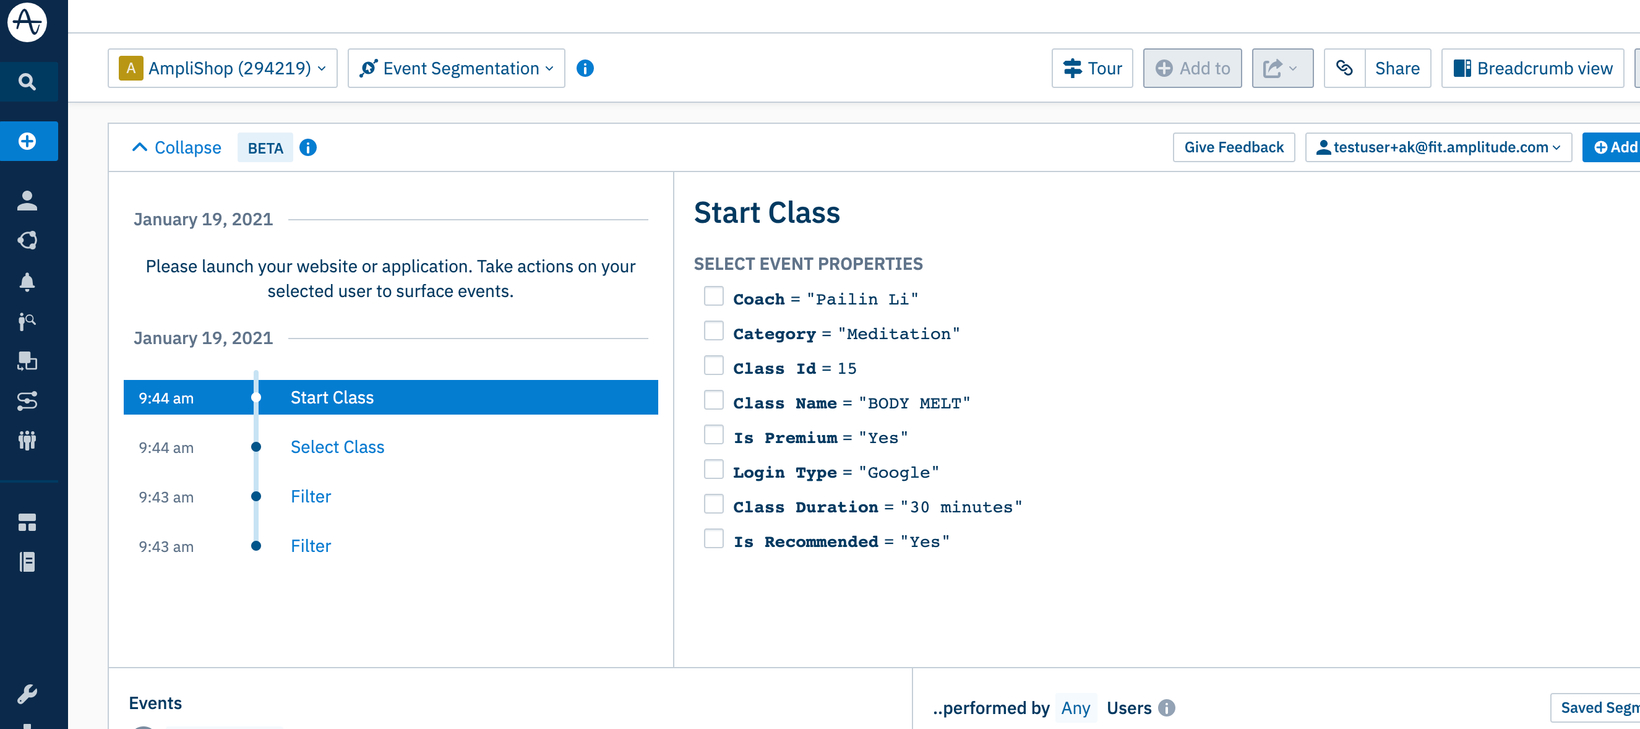
Breadcrumbs
- Jump to Month
- November 2024
- October 2024
- September 2024
- August 2024
- July 2024
- June 2024
- May 2024
- April 2024
- March 2024
- February 2024
- January 2024
- December 2023
- November 2023
- October 2023
- September 2023
- August 2023
- July 2023
- June 2023
- May 2023
- April 2023
- March 2023
- February 2023
- January 2023
- December 2022
- November 2022
- October 2022
- September 2022
- August 2022
- July 2022
- June 2022
- May 2022
- April 2022
- March 2022
- February 2022
- January 2022
- December 2021
- November 2021
- October 2021
- September 2021
- August 2021
- July 2021
- June 2021
- May 2021
- April 2021
- March 2021
- February 2021
- January 2021